Deep Security 11.1 has reached end of support. Use the version selector (above) to see more recent versions of the Help Center.
Monitor application control events
For an overview of application control, see Lock down software with application control. For initial configuration instructions, see Set up application control.
By default, when you enable application control it logs events, such as when there are software changes or when it blocks software from executing. Application control events appear on the Actions and Events & Reports pages. If configured, an alert appears on the Alerts page.
You can configure some of which application control event logs are recorded, and which are forwarded to external SIEM systems, or syslog servers.
To monitor for software changes on computers:
- Choose which application control events to log
- View application control event logs
- Interpret aggregated security events
- Monitor application control alerts
Choose which application control events to log
- Go to Administration > System Settings > System Events.
- Scroll down to the application control events such as Event ID 7000 "Application Control Events Exported".
-
If you want to record event logs for that type of event, select Record.
When those events occur, they appear on Events & Reports > Events > System Events. Logs are kept until they meet maximum log age criteria. For details, see Event collection in Deep Security.
Events that appear on Computers > Details > Application Control > Events are not configured here. They are always logged. - If you want to forward event logs to a SIEM, or syslog server, select Forward.
-
If you use an external SIEM, you may need to load the list of possible application control event logs, and indicate what action to take. For a list of application control events, see System events.
View application control event logs
Application control generates system events and security events:
- System event: An audit event that provides a history of configuration changes or software updates. To see system events click Events & Reports > Events > System Events. For a list, see System events.
- Security event: An event that occurs on the agent when application control blocks or allows unrecognized software, or blocks software due to a block rule. To see security events, click Events & Reports > Events > Application Control Events > Security Events.
Interpret aggregated security events
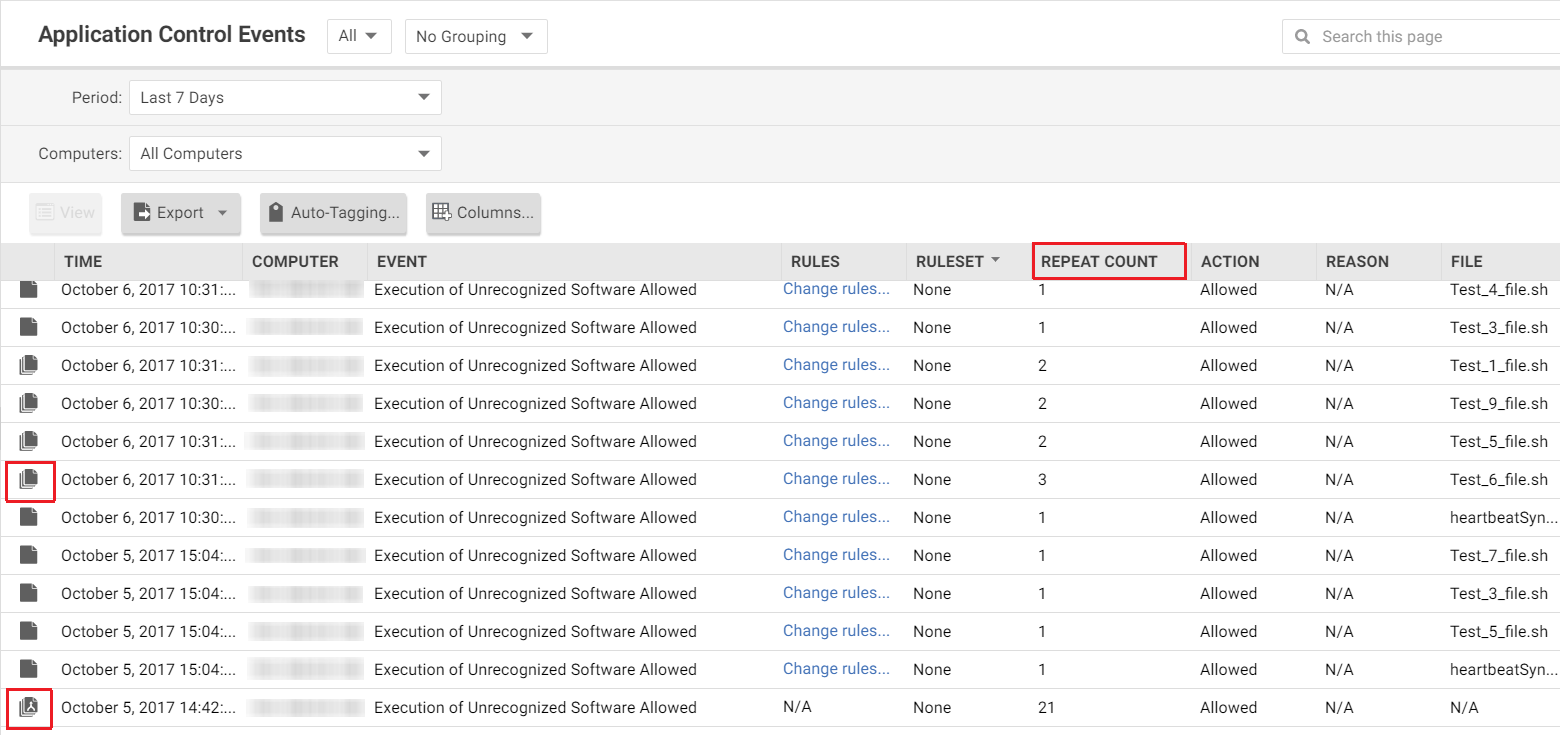
When an agent heartbeat includes several instances of the same security event, Deep Security aggregates the events in the Security Events log. Event aggregation reduces the number of items in the log, making it easier to find important events:
- When the event occurs for the same file, which is usually the case, the log includes the file name with the aggregated event. For example, a heartbeat includes 3 instances of the "Execution of Unrecognized Software Allowed" event for the Test_6_file.sh file, and no other instances of that event. Deep Security aggregates these 3 events for the file Test_6_file.sh.
- When the event occurs for many files, the log omits the file names. For example, a heartbeat includes 21 instances of the "Execution of Unrecognized Software Allowed" event that occurred for several different files. Deep Security aggregates the 21 events in a single event, but does not include a file name.
When aggregated events apply to multiple files, other occurrences of these events have likely been reported in other heartbeats. After you respond to other events where the file name is known, it is likely that no more aggregated events occur.
In the log, aggregated events use special icons, and the Repeat Count column indicates the number of events that are aggregated.

Monitor application control alerts
To configure which application control events or severity levels cause an alert, go to the Alerts tab, click the Configure Alerts button, and then select an event and double-click Properties. For details, see Configure alerts.
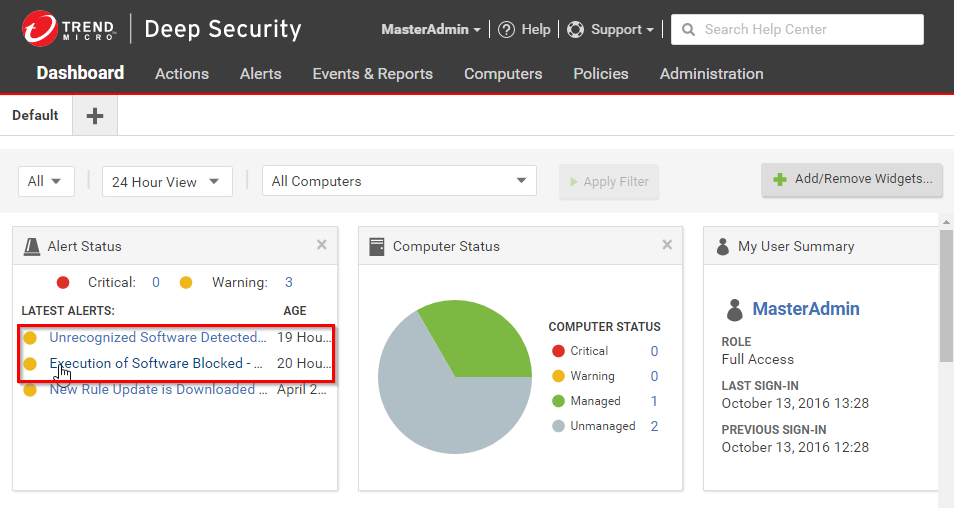
When alerts are enabled for application control events, any software change that the application control engine detects and any software that it blocks from executing appear in the Alerts tab. If you have enabled the Alert Status widget, application control alerts also appear on the Dashboard.

To monitor which computers are in maintenance mode, you can also click Add/Remove Widgets and enable the Application Control Maintenance Mode widget, which displays a list of the computers and their scheduled maintenance windows.