Deep Security 10.1 has reached end of support. Use the version selector (above) to see more recent versions of the Help Center.
Intrusion prevention events
This article covers how to access and work with intrusion prevention events. For general best practices related to events, see Events in Deep Security.
To see the intrusion prevention events captured by Deep Security, go to Events & Reports > Events > Intrusion Prevention Events.
What information is displayed for intrusion prevention events?
These columns can be displayed on the Intrusion Prevention Events page. You can click Columns to select which columns are displayed in the table.
- Time: Time the event took place on the computer.
- Computer: The computer on which this event was logged. (If the computer has been removed, this entry will read "Unknown Computer".)
- Reason: The intrusion prevention rule associated with this event.
- Tag(s): Any tags attached with the event.
- Application Type: The application type associated with the intrusion prevention rule which caused this event.
- Action: What action the intrusion prevention rule took (Block or Reset). If the rule is in Detect Only mode, the action is prefaced with "Detect Only:").
Intrusion prevention rules created before Deep Security 7.5 SP1 could also perform Insert, Replace, and Delete actions. These actions are no longer performed. If an older rule is triggered and attempts to perform those actions, the event will indicate that the rule was applied in detect-only mode.
- Rank: The ranking system provides a way to quantify the importance of intrusion prevention and firewall events. By assigning "asset values" to computers, and assigning "severity values" to intrusion prevention rules and firewall rules, the importance ("rank") of an event is calculated by multiplying the two values together. This allows you to sort events by rank when viewing intrusion prevention or firewall events.
- Severity: The intrusion prevention rule's severity value.
- Direction: The direction of the packet (incoming or outgoing)
- Flow: whether the packets(s) that triggered this event was travelling with ("Connection Flow") or against ("Reverse Flow") the direction of traffic being monitored by the intrusion prevention rule.
- Interface: The MAC address of the interface through which the packet was passing.
- Frame Type: The frame type of the packet in question. Possible values are "IPV4", "IPV6", "ARP", "REVARP", and "Other: XXXX" where XXXX represents the four digit hex code of the frame type.
- Protocol: Possible values are "ICMP", "ICMPV6", "IGMP", "GGP", "TCP", "PUP", "UDP", "IDP", "ND", "RAW", "TCP+UDP", AND "Other: nnn" where nnn represents a three digit decimal value.
- Flags: Flags set in the packet.
- Source IP: The packet's source IP.
- Source MAC: The packet's source MAC address.
- Source Port: The packet's source port.
- Destination IP: The packet's destination IP address.
- Destination MAC: The packet's destination MAC address.
- Destination Port: The packet's destination port.
- Packet Size: The size of the packet in bytes.
- Repeat Count: The number of times the event was sequentially repeated.
- Time (microseconds): Microsecond resolution for the time the event took place on the computer.
- Event Origin: The Deep Security component from which the event originated.
See details about an event
Double-clicking an event (or right-clicking an event and clicking View) displays a window that contains additional information about the event. The Tags tab displays tags that have been attached to this event. For more information on event tagging, see Apply tags to identify and group events.
You can also right-click an event and select Computer Details to open the Computer editor for the computer that generated the event.
Find a particular event
You can use the lists at the top of each events page to filter and group the events. Select the values that you want to filter for and then click the large search button on the right side to apply the filter. You can also use the search bar in the upper-right corner to search for a specific event.
To perform an advanced search, click the arrow in the Search bar and select Open Advanced Search.
The Period setting lets you filter the list to display only those events that occurred within a specific time-frame.
The Computers setting lets you organize the display of event log entries by computer, computer groups or policies.
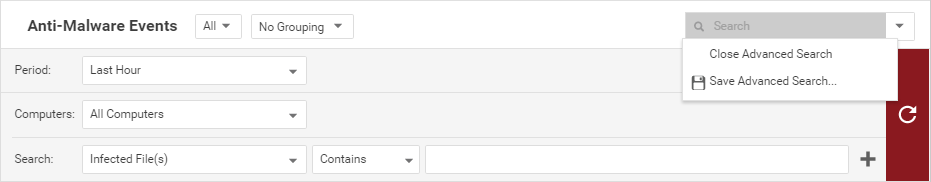
Advanced Search functions (searches are not case sensitive):
- Contains: The entry in the selected column contains the search string
- Does Not Contain: The entry in the selected column does not contain the search string
- Equals: The entry in the selected column exactly matches the search string
- Does Not Equal: The entry in the selected column does not exactly match the search string
- In: The entry in the selected column exactly matches one of the comma-separated search string entries
- Not In: The entry in the selected column does not exactly match any of the comma-separated search string entries
Pressing the "plus" button (+) to the right of the search bar will display an additional search bar so you can apply multiple parameters to your search. When your search parameters are ready, click the large blue arrow on the right side.
Export a list of events
Clicking Export exports all or selected events to a CSV file.
Tag events
Clicking Auto-Tagging displays a list of existing auto-tagging rules that have been applied to the events. You can also right-click an event to manually add or remove tags. (See Apply tags to identify and group events.)