Deep Security 10.1 has reached end of support. Use the version selector (above) to see more recent versions of the Help Center.
Customize the dashboard
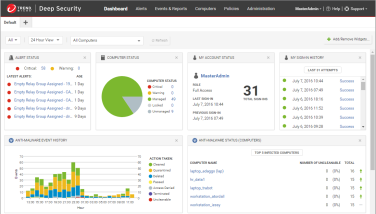
The dashboard is the first page that appears after you log into Deep Security Manager.
Each user can customize the contents and layout of their dashboard. Deep Security Manager automatically saves your settings, and will remember your dashboard the next time that you log in. You can also configure the data's time period, and which computer's or computer group's data is displayed.
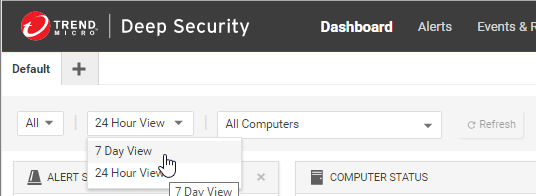
Date and time range
The dashboard can display data from either the last 24 hours, or the last seven days.
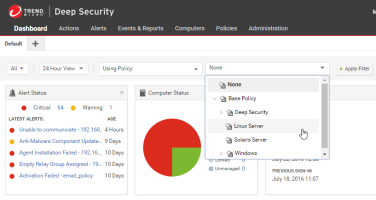
Computers and computer groups
Use the Computer menu to filter the displayed data to display only data from specific computers. For example, only those using the Linux Server security policy:
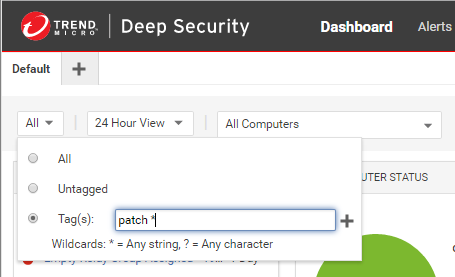
Filter by tags
In Deep Security, a Tag is a unit of meta-data that you can apply to an Event in order to create an additional attribute for the Event that is not originally contained within the Event itself. Tags can be used to filter Events in order to simplify the task of Event monitoring and management. A typical use of tagging is to distinguish between Events that require action and those that have been investigated and found to be benign.
The data displayed in the Dashboard can be filtered by tags:
For more information on tagging see Apply tags to identify and group events.
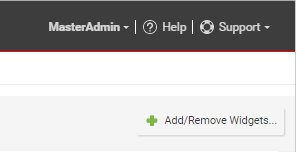
Select dashboard widgets
Click Add/Remove Widgets to display the widget selection window and choose which widgets to display.
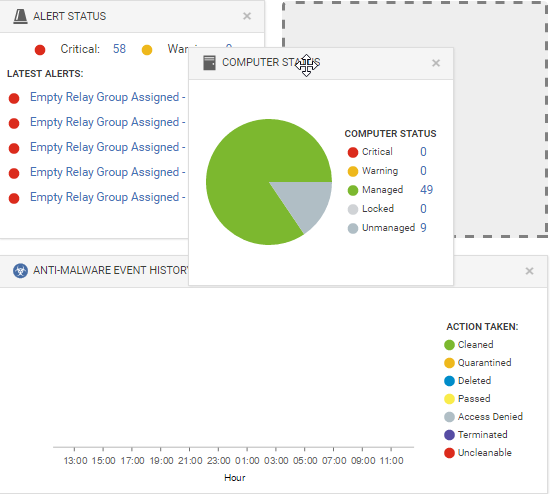
Change the layout
The selected widgets can be moved around the dashboard by dragging them by their title bar. Move the widget over an existing one and they will exchange places. (The widget that is about to be displaced will temporarily gray out.)
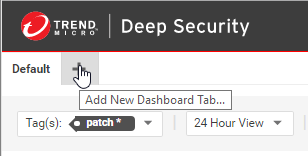
Save and manage dashboard layouts
You can create multiple dashboard layouts and save them as separate tabs. Your Dashboard settings and layouts will not be visible to other Users after you sign out. To create a new Dashboard tab, click the "plus" symbol to the right of the last tab on the Dashboard: